In the React One Day Tour, we took a quick peek at how to use React to make a simple, interactive plot. Today, let's take a step back and look at the basics of JavaScript. React is a JavaScript framework, so knowledge of JavaScript is useful to fully grasp React. In fact, you can make pretty amazing visualizations with just JavaScript, such as with libraries like D3.js or Chart.js. Even 3D graphics can be done using Three.js.
Personally, if I'm starting a new project, I'd still go with React instead of vanilla JavaScript, since React comes with more functionality like state management, routing, and more. Indeed, React is the current reigning champion of web development framework. Regardless of which web (or even mobile!) application is your favorite, chances are it's built with React (or React Native for mobile apps).
But given that React is a JavaScript framework, we are obligated to have some working knowledge of JavaScript. So in today's one day tour, let's have a whirlwind introduction to JavaScript!
Prerequisites
We will use Vite to scaffold our project, just like we did in React One Day Tour. That means you should have Vite installed. So if you haven't already, go to React One Day Tour for instructions on installing Node.js and Vite.
1. Create a JavaScript App
With Vite, creating a new JavaScript project is as easy as running a single command:
> npm create vite@latest simple-js-app -- --template vanillaThen, go to the project directory, and run npm install, as well as npm run dev. You now have a simple JavaScript app running on http://localhost:5173/.
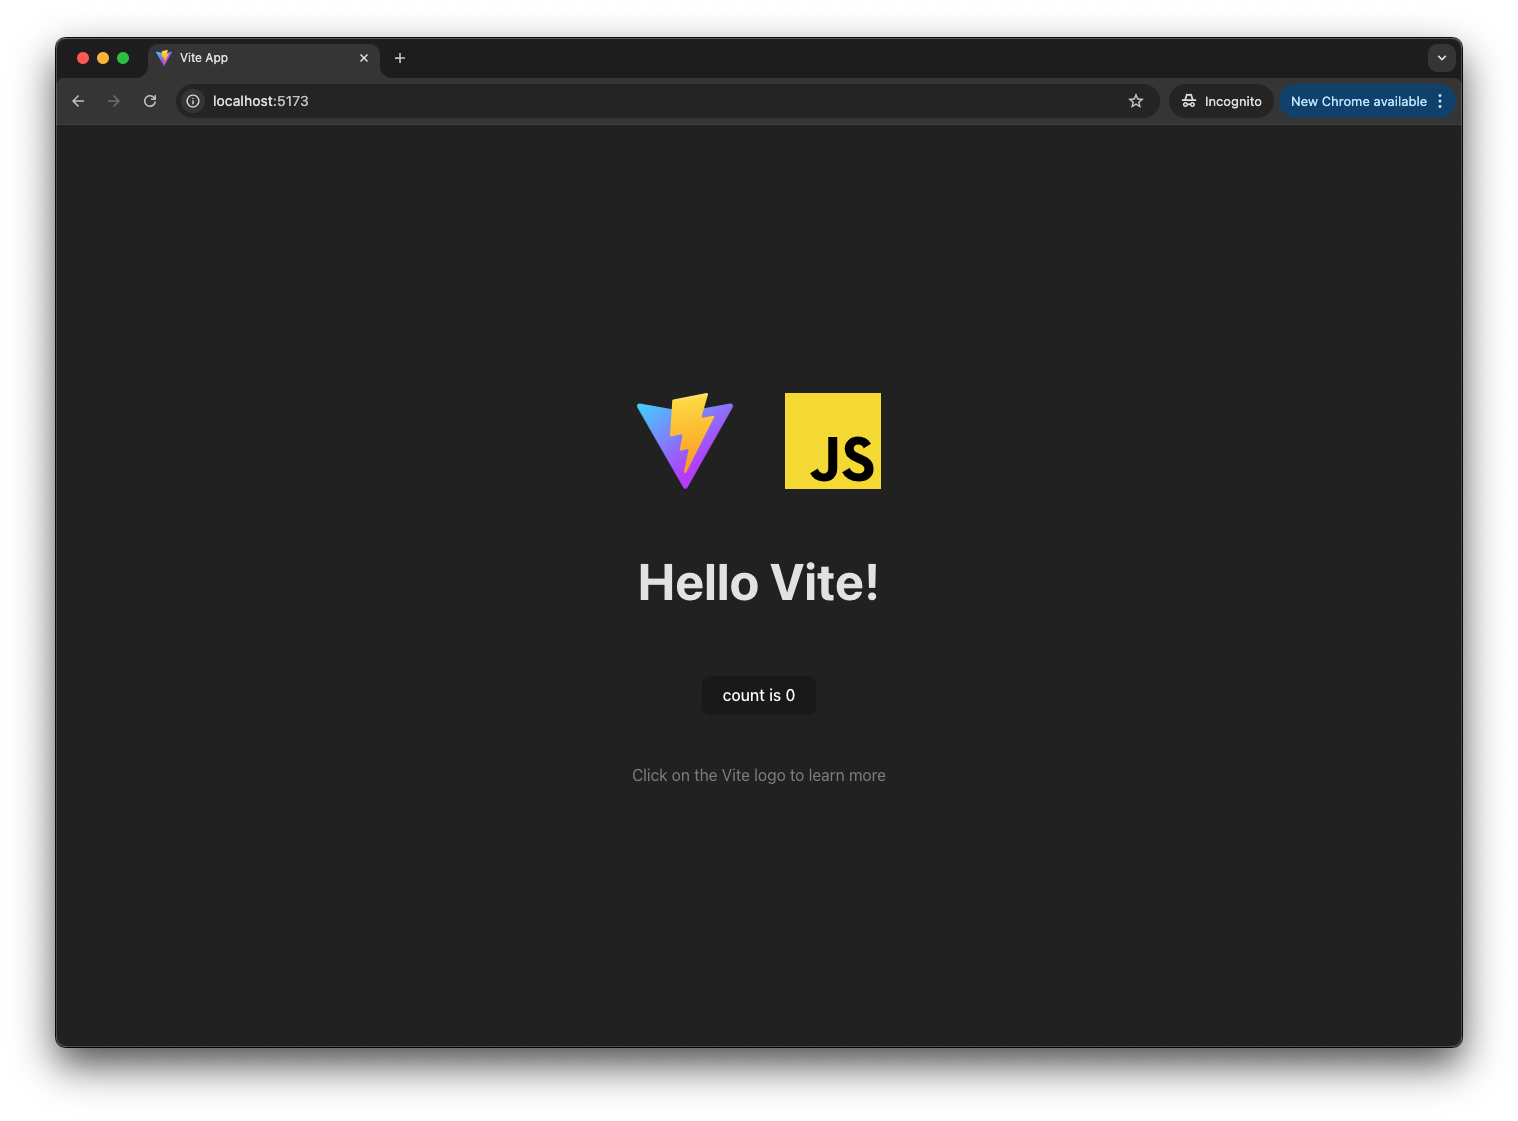
Notably, this app only has 9 files. And out of these, we will only need to work on three of them.
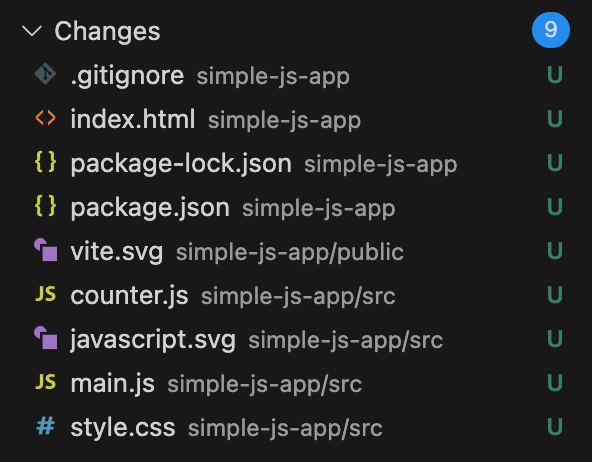
index.html: This is the first file browsers load when visiting our site. Think of it as the "main container" that brings everything together: it defines the page structure, loads our JavaScript code, applies our CSS styles, and ultimately hosts our visualization.main.js: This is where we'll write our core JavaScript code. It's the brain of our application, containing all the logic for creating and manipulating our visualizations, handling user interactions, and processing data.style.css: This is where we'll define how our visualization looks. It controls everything from colors and fonts to layout and animations, helping us make our visualization both beautiful and user-friendly. While we won't dive deep into CSS in this tutorial, its importance to web development cannot be overstated - great visualizations need great styling! For a proper introduction to CSS, I recommend MDN's CSS tutorial.
There are also the other six files that we don't need to worry about for now, but just quickly, they are:
.gitignore: This file tells Git which files to ignore when committing changes. You probably already know about it.package.json: This file contains metadata about our project, including the project name, version, dependencies, and scripts.package-lock.json: This file is automatically generated when you runnpm install, ensuring everyone working on the project uses the exact same versions of dependencies.vite.svgandjavascript.svg: These are logo image files used in the template.counter.js: Now this is an interesting file.counter.jscontains a simple counter implementation that demonstrates JavaScript state management through closures. It's handling the "count is 0" functionality, which, in React, is done withuseState. While this is a nice example of how vanilla JavaScript can manage application state, today we will not be too concerned with state management.
2. Strip the App Down to the Bare Bones
There are only three files we will be working with, index.html, main.js, and style.css. First, let's parse down these files, and through this process, understand better what each is doing.
For index.html, we are just modifying the site title, and you can optionally use a logo file for the favicon.
<!-- index.html -->
<!DOCTYPE html>
<html lang="en">
  <head>
    <meta charset="UTF-8" />
    <!-- You can use your own favicon here; just make sure to place the file in the "public" folder. -->
    <link rel="icon" type="image/svg+xml" href="/logo-unicorn.svg" />
    <meta name="viewport" content="width=device-width, initial-scale=1.0" />
    <!-- Rename the title.  -->
    <title>SVG Scatter Plot</title>
  </head>
  <body>
    <div id="app"></div>
    <script type="module" src="/src/main.js"></script>
  </body>
</html>
We will drastically reduce main.js, leaving just one line of text.
// src/main.js
import "./style.css";

document.querySelector("#app").innerHTML = `
  <div>
    <h1>Do you want to make a scatter plot?</h1>
  </div>
`;
And because we removed so many UI elements from main.js, we can also correspondingly remove the styles that are no longer relevant from style.css.
/* style.css */
:root {
  font-family: Inter, system-ui, Avenir, Helvetica, Arial, sans-serif;
  line-height: 1.5;
  font-weight: 400;

  color-scheme: light dark;
  color: rgba(255, 255, 255, 0.87);
  background-color: #242424;

  font-synthesis: none;
  text-rendering: optimizeLegibility;
  -webkit-font-smoothing: antialiased;
  -moz-osx-font-smoothing: grayscale;
}

body {
  margin: 0;
  display: flex;
  place-items: center;
  min-width: 320px;
  min-height: 100vh;
}

h1 {
  font-size: 3.2em;
  line-height: 1.1;
}

#app {
  max-width: 1280px;
  margin: 0 auto;
  padding: 2rem;
  text-align: center;
}
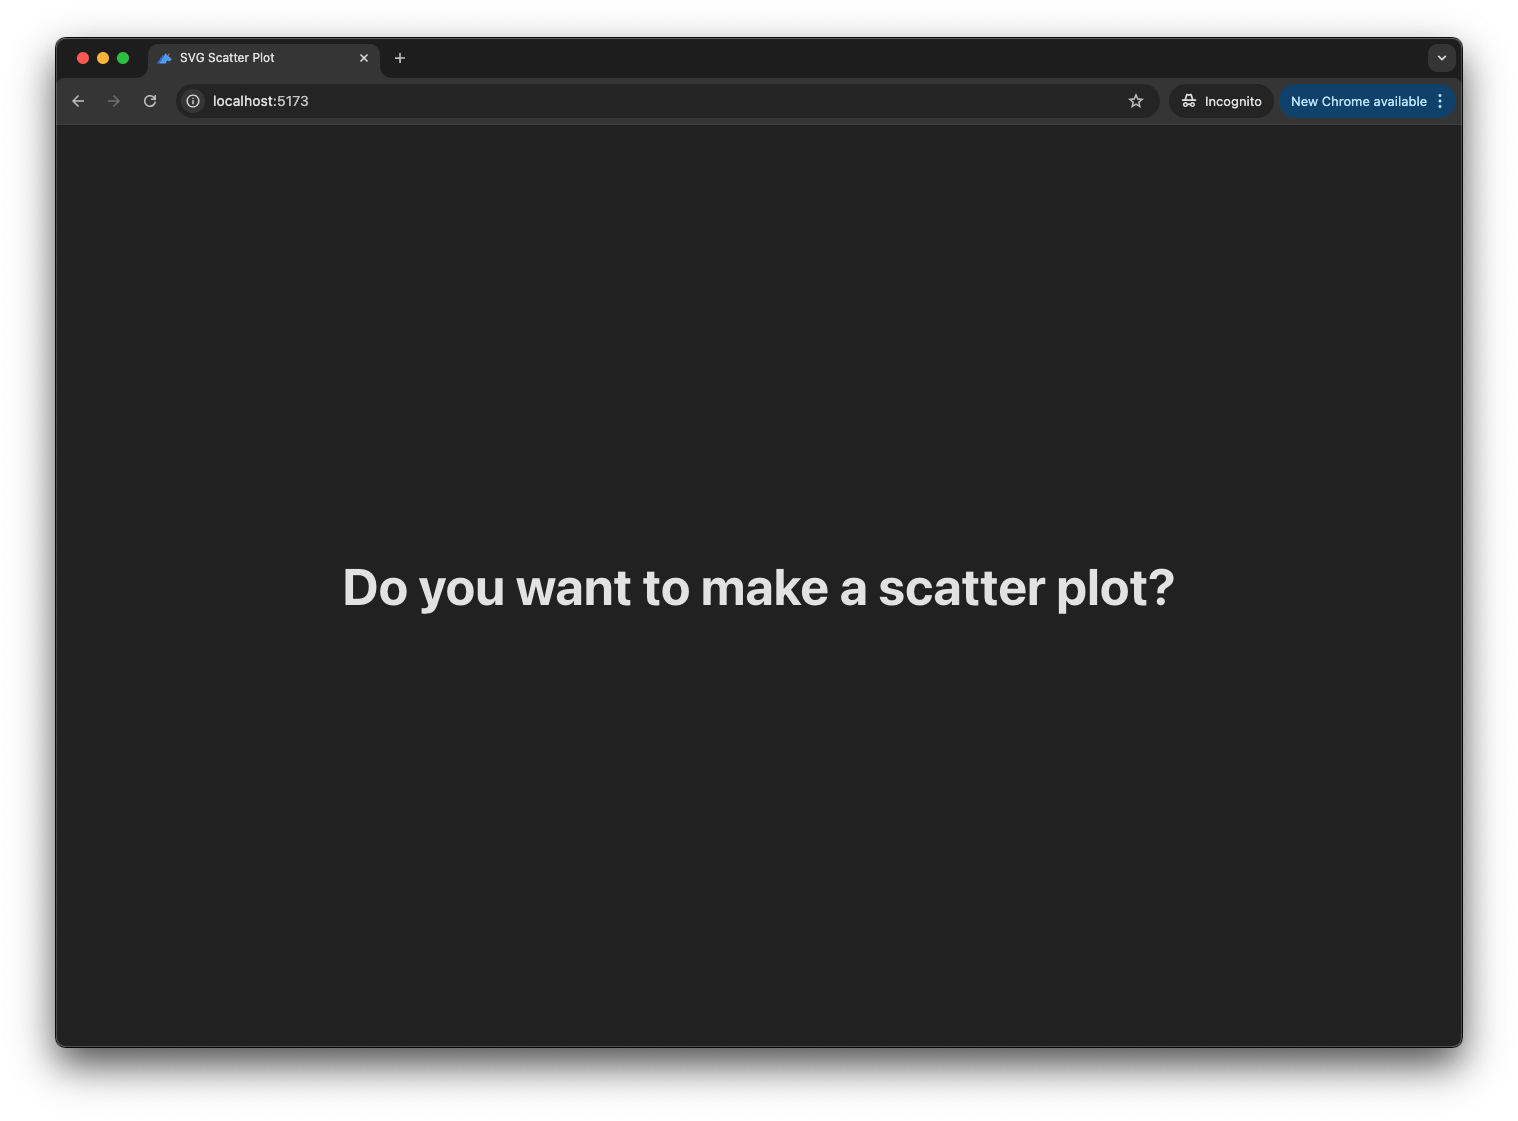
Now we have a super simple JavaScript site.
3. DOM: Document Object Model
When you load a webpage, the browser takes the HTML and creates a tree-like structure called the Document Object Model, or DOM. Think of it as the browser's internal representation of your webpage, where every HTML element becomes a "node" in this tree.
In fact, no matter what web framework you use - whether it's React, Vue, Angular, or others - they all ultimately manipulate this same DOM. The framework code gets compiled or interpreted into JavaScript that creates, updates, and removes DOM elements. The frameworks just provide more convenient ways to describe and manage these DOM operations, often with features like virtual DOM for performance optimization.
Let's look at our current page structure using Chrome's Developer Tools (or DevTools). You can open DevTools by:
- Right-clicking anywhere on the page and selecting "Inspect"
- Using the keyboard shortcut:
- Windows/Linux:
Ctrl + Shift + I - Mac:
Cmd + Option + I
- Windows/Linux:
In the Elements tab, you'll see something like this:
<!DOCTYPE html>
<html>
  <head>
    <!-- metadata, styles, etc. -->
  </head>
  <body>
    <div id="app">
      <div>
        <h1>Do you want to make a scatter plot?</h1>
      </div>
    </div>
    <script type="module" src="/src/main.js?t=1733031155966"></script>
  </body>
</html>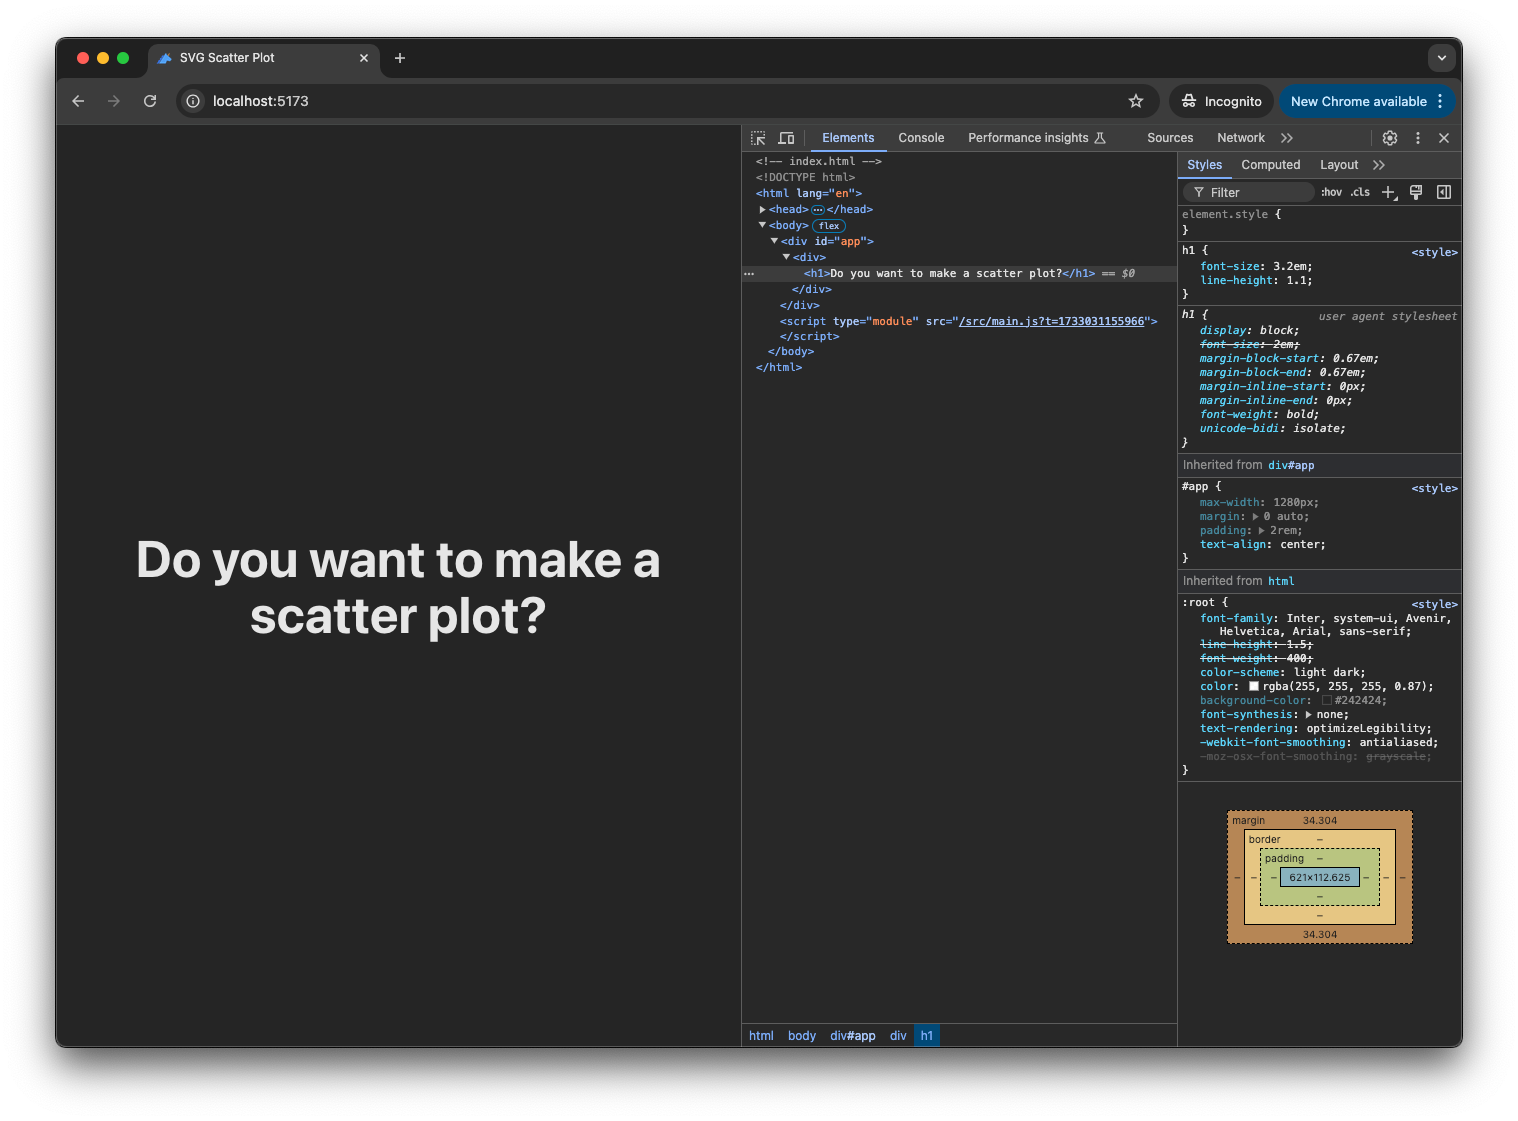
This will look very similar to index.html, except you can recognize that the "Do you want to make a scatter plot?" text is coming from main.js. We are manipulating the DOM using JavaScript!
In main.js, you can see the DOM being referenced as document. We select the #app element, and then modify its innerHTML property to be the HTML string:
<div>
  <h1>Do you want to make a scatter plot?</h1>
</div>
Common DOM Methods and Properties
Besides the querySelector method we are using in main.js, there are other common ways of interacting with DOM elements in Javascript.
- Finding elements (
querySelector,getElementById) - Creating and deleting elements (
createElement,remove) - Modifying content and attributes (
textContent,setAttribute) - Managing classes (
classList.add,classList.remove) - Handling events like a mouse click (
addEventListener) - Getting element information (
getBoundingClientRect)
For a comprehensive list, check out the DOM API Reference from MDN Web Docs.
DOM Manipulation in JavaScript
As you saw, we can do DOM manipulation by modifying innerHTML. But I'm not a big fan of this method, because we are encoding HTML code as plain text. As part of a template, it's totally fine. But you wouldn't want to do this at scale. You don't get the syntax checks that come with code editor, and you can't take advantage of simple language features like variables and functions.
So let's revise main.js to use DOM manipulation methods.
// src/main.js
import "./style.css";

// Get the app element
const app = document.querySelector("#app");

// Create the div and h1 heading elements
const container = document.createElement("div");
const heading = document.createElement("h1");

// Set content
heading.textContent = "Do you want to make a scatter plot?";

// Build the DOM tree
container.appendChild(heading);
app.appendChild(container);
Our app did not change one bit. That's because we are simply using different DOM manipulation methods to create the same div and h1 elements. We can organize this code with a JavaScript function if we'd like. Again, we will have the exact same website as before.
// src/main.js
import "./style.css";

function createAppElement() {
  const app = document.querySelector("#app");

  const container = document.createElement("div");
  const heading = document.createElement("h1");

  heading.textContent = "Do you want to make a scatter plot?";

  container.appendChild(heading);
  app.appendChild(container);
}

createAppElement();
4. SVG: Scalable Vector Graphics
Now that we understand how JavaScript can manipulate webpage elements through the DOM, let's create our visualization. For web-based graphics, SVG (Scalable Vector Graphics) is particularly well-suited for data visualization because:
- It's XML-based (meaning that it is structured like HTML, using tags and attributes). So it is easy to create and modify with JavaScript, and integrates naturally with the DOM
- Elements remain interactive (easy to attach event listeners)
- Graphics stay crisp at any resolution (they're vector-based)
- Elements can be styled with CSS
For these reasons, many popular visualization libraries like D3.js primarily use SVG, and we'll use it for our scatter plot as well.
Start with a Circle
You saw that we can create an element using document.createElement (such as document.createElement("div")). For SVG, we use document.createElementNS instead. What we will do is first create an SVG element which will serve as the main container for all SVG graphics. And then, within this SVG container, we will draw a circle.
Then, once we have the SVG container, we will append it to the DOM. With these two steps, our main.js file will look like this:
// src/main.js
import "./style.css";

// Some data points. Can be loaded from a file instead.
const dataPoints = [
  { x: 233.2, y: 238.0 },
  { x: 10.0, y: 12.4 },
  { x: 73.6, y: 76.8 },
  { x: 170.8, y: 167.2 },
  { x: 311.2, y: 313.6 },
  { x: 384.8, y: 382.8 },
  { x: 89.2, y: 79.2 },
  { x: 98.8, y: 92.8 },
  { x: 79.2, y: 98.0 },
  { x: 94.0, y: 86.8 },
  { x: 295.2, y: 304.8 },
  { x: 313.6, y: 318.0 },
  { x: 304.8, y: 325.2 },
  { x: 326.0, y: 311.2 },
  { x: 4.8, y: 1.6 },
  { x: 90.0, y: 19.2 },
  { x: 165.2, y: 68.8 },
  { x: 251.2, y: 154.0 },
  { x: 325.6, y: 262.8 },
  { x: 394.8, y: 388.8 },
];

function createScatterPlot(data) {
  // Set the width and height of the SVG element.
  const width = 600;
  const height = 600;

  // Create the SVG element using "createElementNS"
  // "createElementNS" is a special method used for creating XML/SVG elements
  // because SVG uses a different XML namespace than regular HTML.
  const svg = document.createElementNS("http://www.w3.org/2000/svg", "svg");
  svg.setAttribute("width", width);
  svg.setAttribute("height", height);

  // Draw a circle positioned for the first data point.
  const dataPoint = data[0];
  const circle = document.createElementNS(
    "http://www.w3.org/2000/svg",
    "circle",
  );
  circle.setAttribute("cx", dataPoint.x);
  circle.setAttribute("cy", dataPoint.y);
  circle.setAttribute("r", "8");
  circle.setAttribute("fill", "#52A1F6");
  svg.appendChild(circle);

  return svg;
}

function createAppElement() {
  // Get the app element
  const app = document.querySelector("#app");

  // Create the div and h1 heading elements.
  const container = document.createElement("div");
  const heading = document.createElement("h1");
  heading.textContent = "Here is a Circle";
  container.appendChild(heading);

  // Create the scatter plot inside the container.
  const scatterPlot = createScatterPlot(dataPoints);
  container.appendChild(scatterPlot);

  app.appendChild(container);
}

createAppElement();
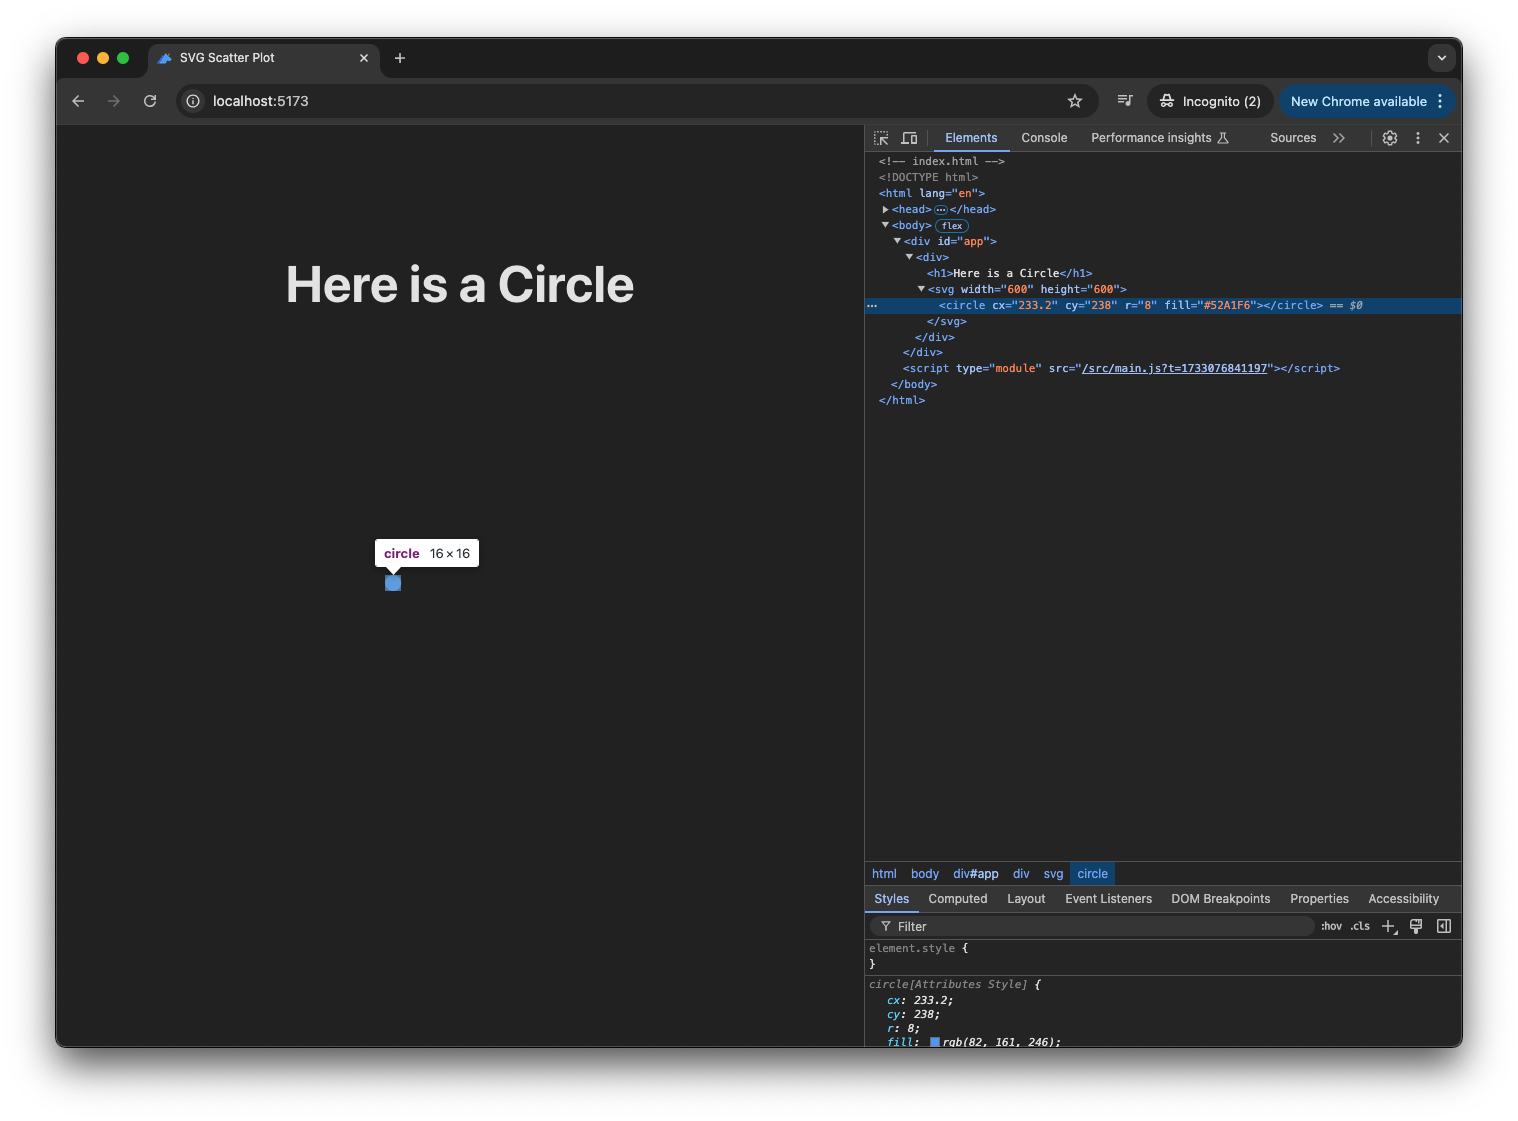
And now our app has one circle. More importantly, if we look at the "Elements" tab in Developer tools, we see an <svg /> tag. Inside the <svg /> tag, we have a <circle /> primitive. That's exactly what we have done! We have drawn one single SVG circle.
Now, Many Circles
For a scatter plot, we can draw a circle for each of the data points. In JavaScript, we can iterate through an array with forEach():
// src/main.js

// Other code remains the same.

function createScatterPlot(data) {
  // Set the width and height of the SVG element.
  const width = 600;
  const height = 600;
  // You can choose some padding to position the plot.
  const padding = 100;

  // Create the SVG element using "createElementNS"
  // "createElementNS" is a special method used for creating XML/SVG elements
  // because SVG uses a different XML namespace than regular HTML.
  const svg = document.createElementNS("http://www.w3.org/2000/svg", "svg");
  svg.setAttribute("width", width);
  svg.setAttribute("height", height);

  // Draw circles corresponding to each data point.
  data.forEach((dataPoint) => {
    const circle = document.createElementNS(
      "http://www.w3.org/2000/svg",
      "circle",
    );
    circle.setAttribute("cx", dataPoint.x + padding);
    circle.setAttribute("cy", dataPoint.y + padding);
    circle.setAttribute("r", "8");
    circle.setAttribute("fill", "#52A1F6");
    svg.appendChild(circle);
  });

  return svg;
}

// Other code remains the same.
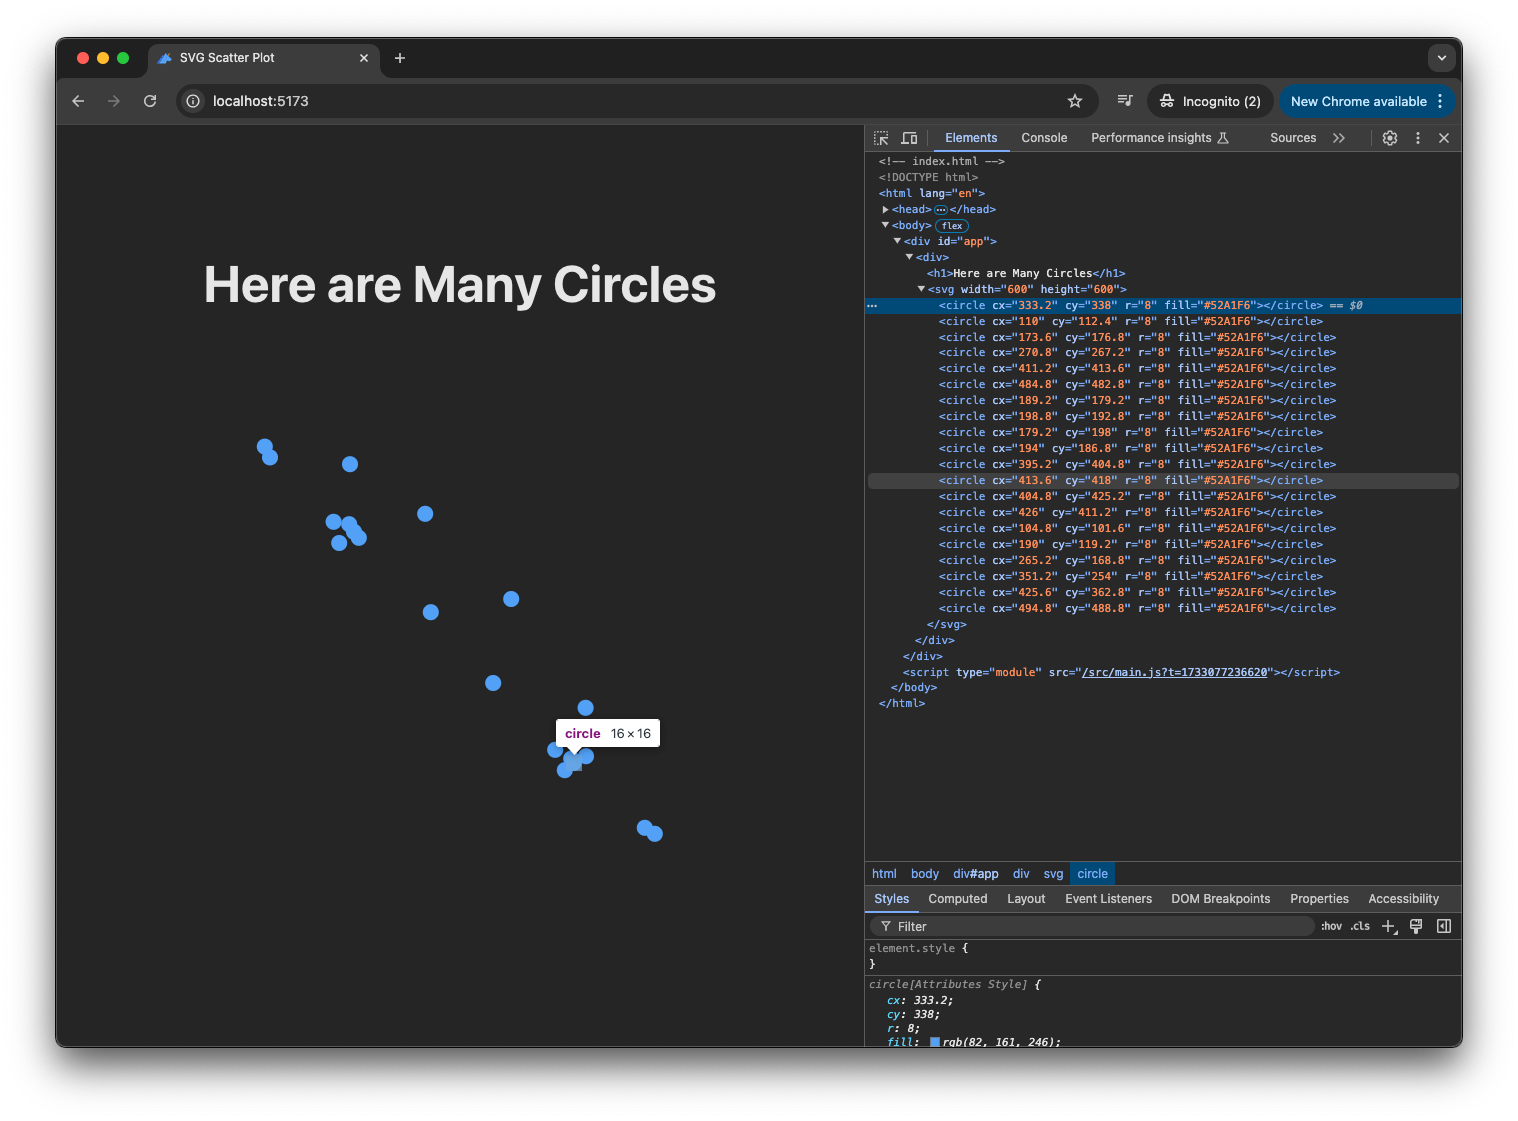
We now have all the circles! The scatter plot is taking shape. More importantly, looking at the Elements tab again, we have now many <circle /> elements as expected.
SVG Coordinates vs Standard Coordinates
Something looks a bit funny with these data points. If we look at the x and y values, we roughly see positive correlation between the x and y values. But the scatter plot is showing negative correlation.
const dataPoints = [
  { x: 233.2, y: 238.0 },
  { x: 10.0, y: 12.4 },
  { x: 73.6, y: 76.8 },
  { x: 170.8, y: 167.2 },
  { x: 311.2, y: 313.6 },
  { x: 384.8, y: 382.8 },
  { x: 89.2, y: 79.2 },
  { x: 98.8, y: 92.8 },
  { x: 79.2, y: 98.0 },
  { x: 94.0, y: 86.8 },
  { x: 295.2, y: 304.8 },
  { x: 313.6, y: 318.0 },
  { x: 304.8, y: 325.2 },
  { x: 326.0, y: 311.2 },
  { x: 4.8, y: 1.6 },
  { x: 90.0, y: 19.2 },
  { x: 165.2, y: 68.8 },
  { x: 251.2, y: 154.0 },
  { x: 325.6, y: 262.8 },
  { x: 394.8, y: 388.8 },
];
This is because the SVG coordinate system, like most computer graphics coordinate system, is not the same as what we learned in math classes. We are drawing on a screen. And in the screen world, the position of (0, 0) typically means the top-left corner of the screen. Increasing x value goes from left to right, as we'd expect. But increasing y value goes from top of the screen to down. Also, negative position values don't quite make sense in the context of a screen: would that mean we are outside of the screen?
When we define an SVG container, it comes with a coordinate system like this, where (0, 0) is the top-left corner of the element.
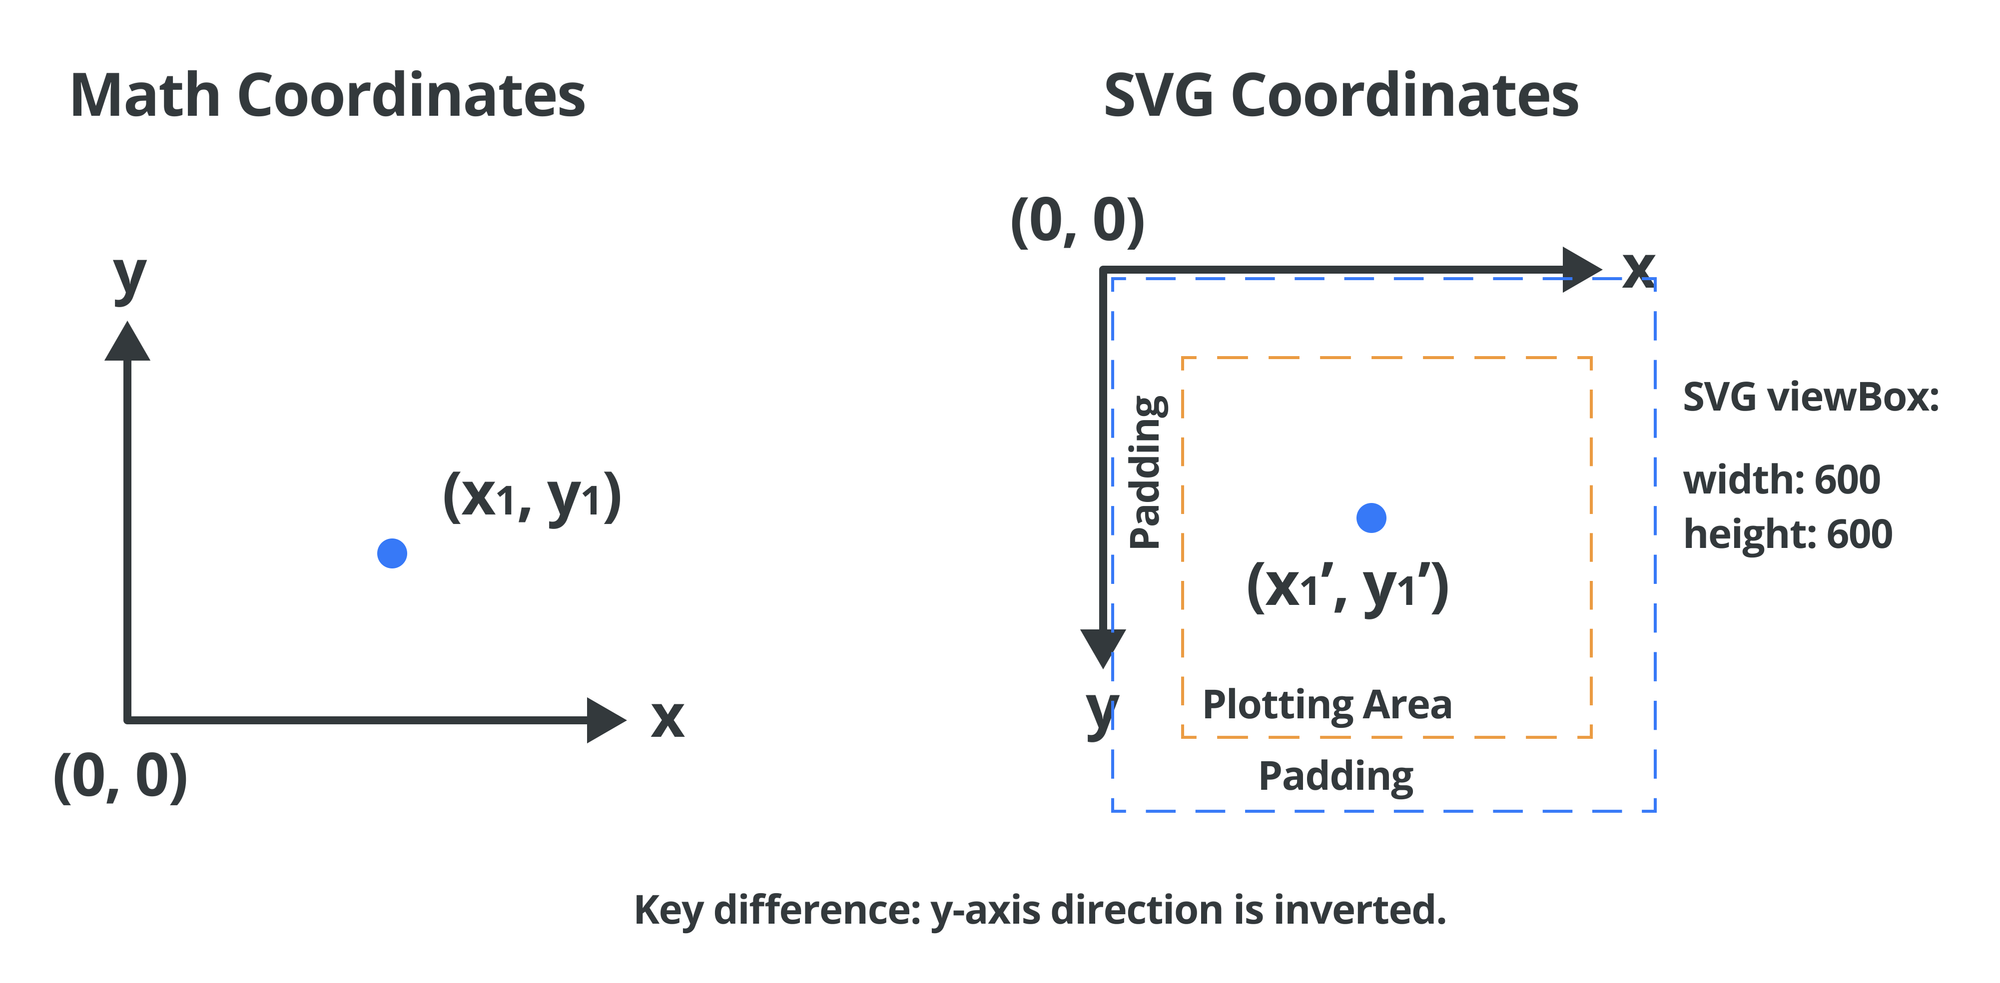
What this means is that we need a conversion function so we can go from math coordinates to SVG coordinates.
// src/main.js

// Other code remains the same.

function getSvgPoint(dataPoint, height, padding) {
  return {
    x: dataPoint.x + padding,
    y: height - dataPoint.y - padding,
  };
}

function createScatterPlot(data) {
  // Set the width and height of the SVG element.
  const width = 600;
  const height = 600;
  // You can choose some padding to position the plot.
  const padding = 100;

  // Create the SVG element using "createElementNS"
  // "createElementNS" is a special method used for creating XML/SVG elements
  // because SVG uses a different XML namespace than regular HTML.
  const svg = document.createElementNS("http://www.w3.org/2000/svg", "svg");
  svg.setAttribute("width", width);
  svg.setAttribute("height", height);

  // Draw circles corresponding to each data point.
  data.forEach((dataPoint) => {
    const circle = document.createElementNS(
      "http://www.w3.org/2000/svg",
      "circle",
    );
    const svgPoint = getSvgPoint(dataPoint, height, padding);
    circle.setAttribute("cx", svgPoint.x);
    circle.setAttribute("cy", svgPoint.y);
    circle.setAttribute("r", "8");
    circle.setAttribute("fill", "#52A1F6");
    svg.appendChild(circle);
  });

  return svg;
}

// Other code remains the same.
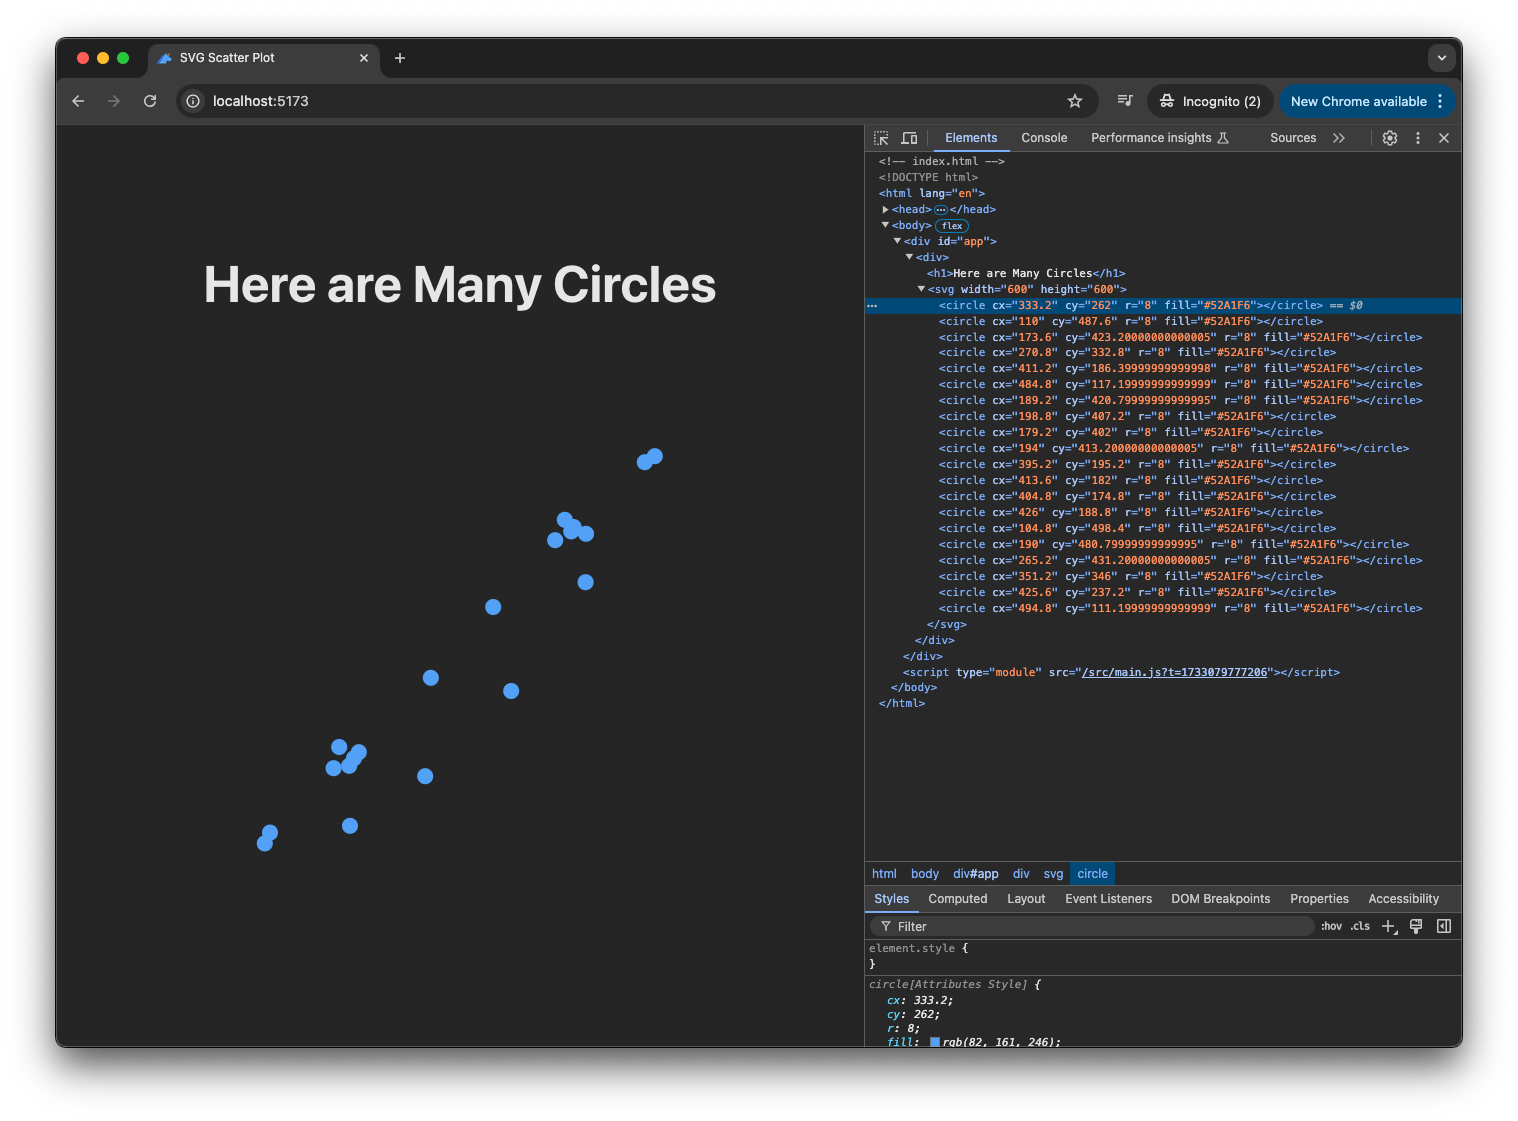
Ok now our plot looks more correct!
Add the Axes
A plot is not complete without some axes. And drawing axes are just like drawing lines. When we draw a line, we define where it starts and where it ends.
// src/main.js

// Other code remains the same.

function createScatterPlot(data) {
  // Set the width and height of the SVG element.
  const width = 600;
  const height = 600;
  // You can choose some padding to position the plot.
  const padding = 100;

  // Create the SVG element using "createElementNS"
  // "createElementNS" is a special method used for creating XML/SVG elements
  // because SVG uses a different XML namespace than regular HTML.
  const svg = document.createElementNS("http://www.w3.org/2000/svg", "svg");
  svg.setAttribute("width", width);
  svg.setAttribute("height", height);

  // Create X axis (horizontal line)
  const xAxis = document.createElementNS("http://www.w3.org/2000/svg", "line");
  xAxis.setAttribute("x1", padding);
  xAxis.setAttribute("y1", height - padding);
  xAxis.setAttribute("x2", width);
  xAxis.setAttribute("y2", height - padding);
  xAxis.setAttribute("stroke", "white");
  svg.appendChild(xAxis);

  // Create Y axis (vertical line)
  const yAxis = document.createElementNS("http://www.w3.org/2000/svg", "line");
  yAxis.setAttribute("x1", padding);
  yAxis.setAttribute("y1", height - padding);
  yAxis.setAttribute("x2", padding);
  yAxis.setAttribute("y2", padding);
  yAxis.setAttribute("stroke", "white");
  svg.appendChild(yAxis);

  // Draw circles corresponding to each data point.
  data.forEach((dataPoint) => {
    const circle = document.createElementNS(
      "http://www.w3.org/2000/svg",
      "circle",
    );
    const svgPoint = getSvgPoint(dataPoint, height, padding);
    circle.setAttribute("cx", svgPoint.x);
    circle.setAttribute("cy", svgPoint.y);
    circle.setAttribute("r", "8");
    circle.setAttribute("fill", "#52A1F6");
    svg.appendChild(circle);
  });

  return svg;
}

// Other code remains the same.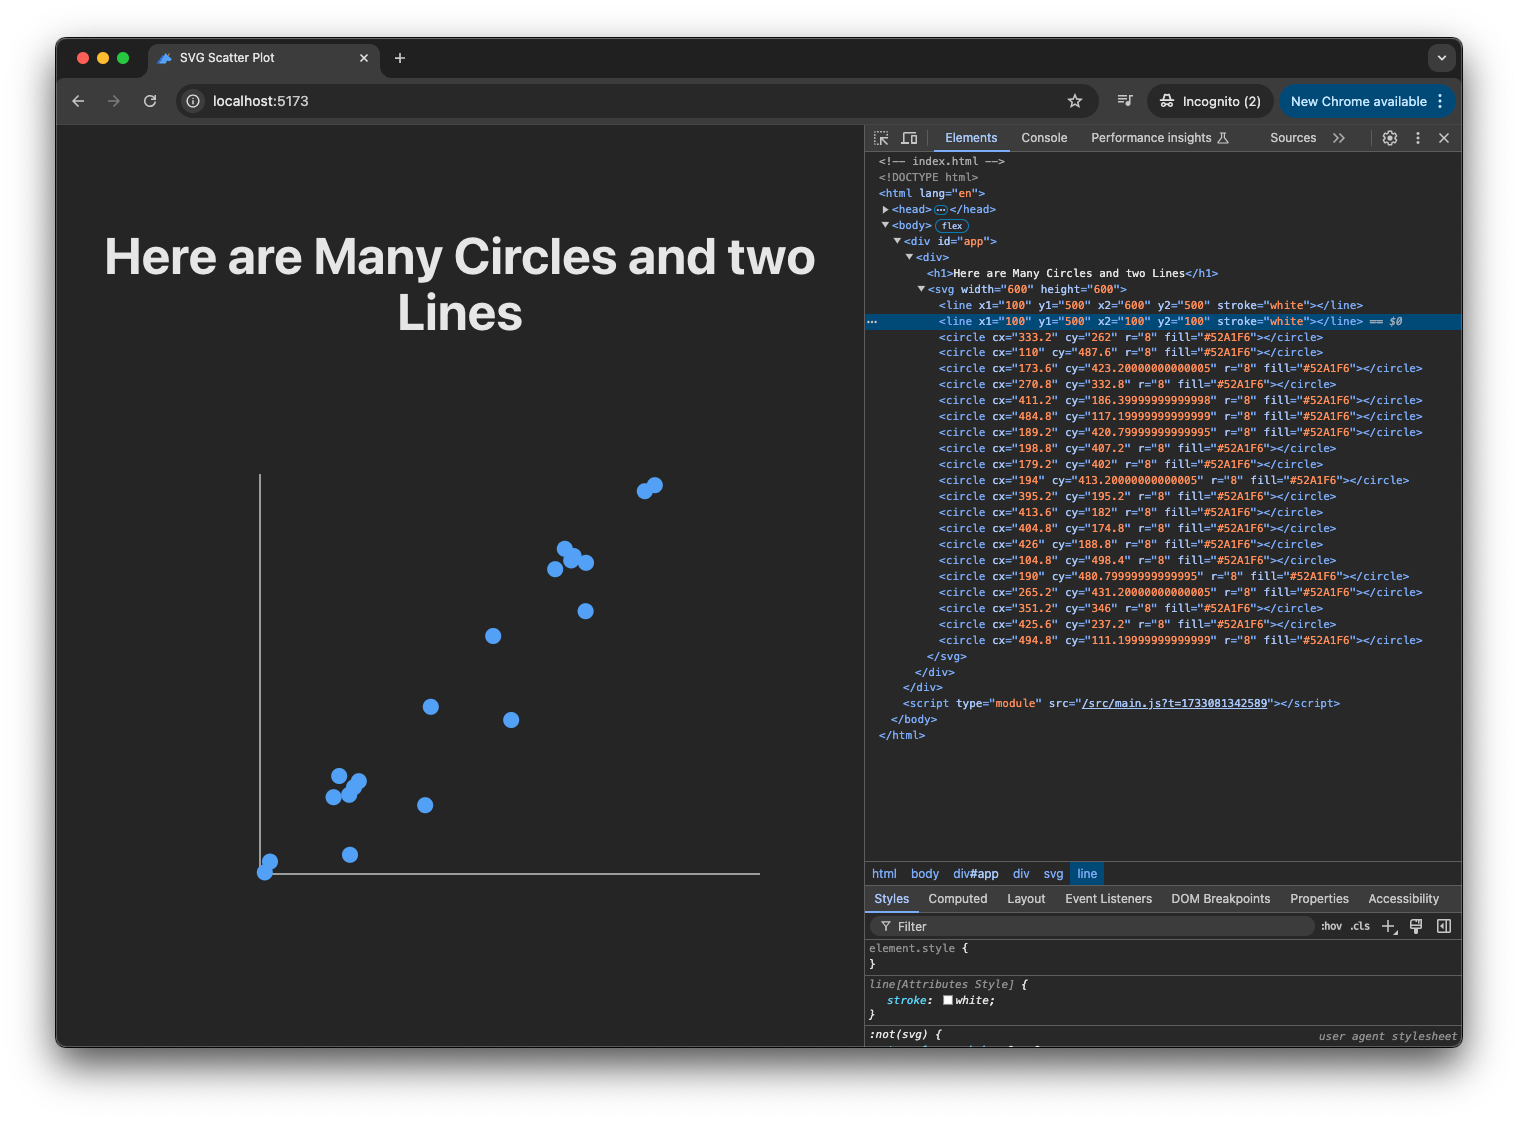
Add Ticks and Labels
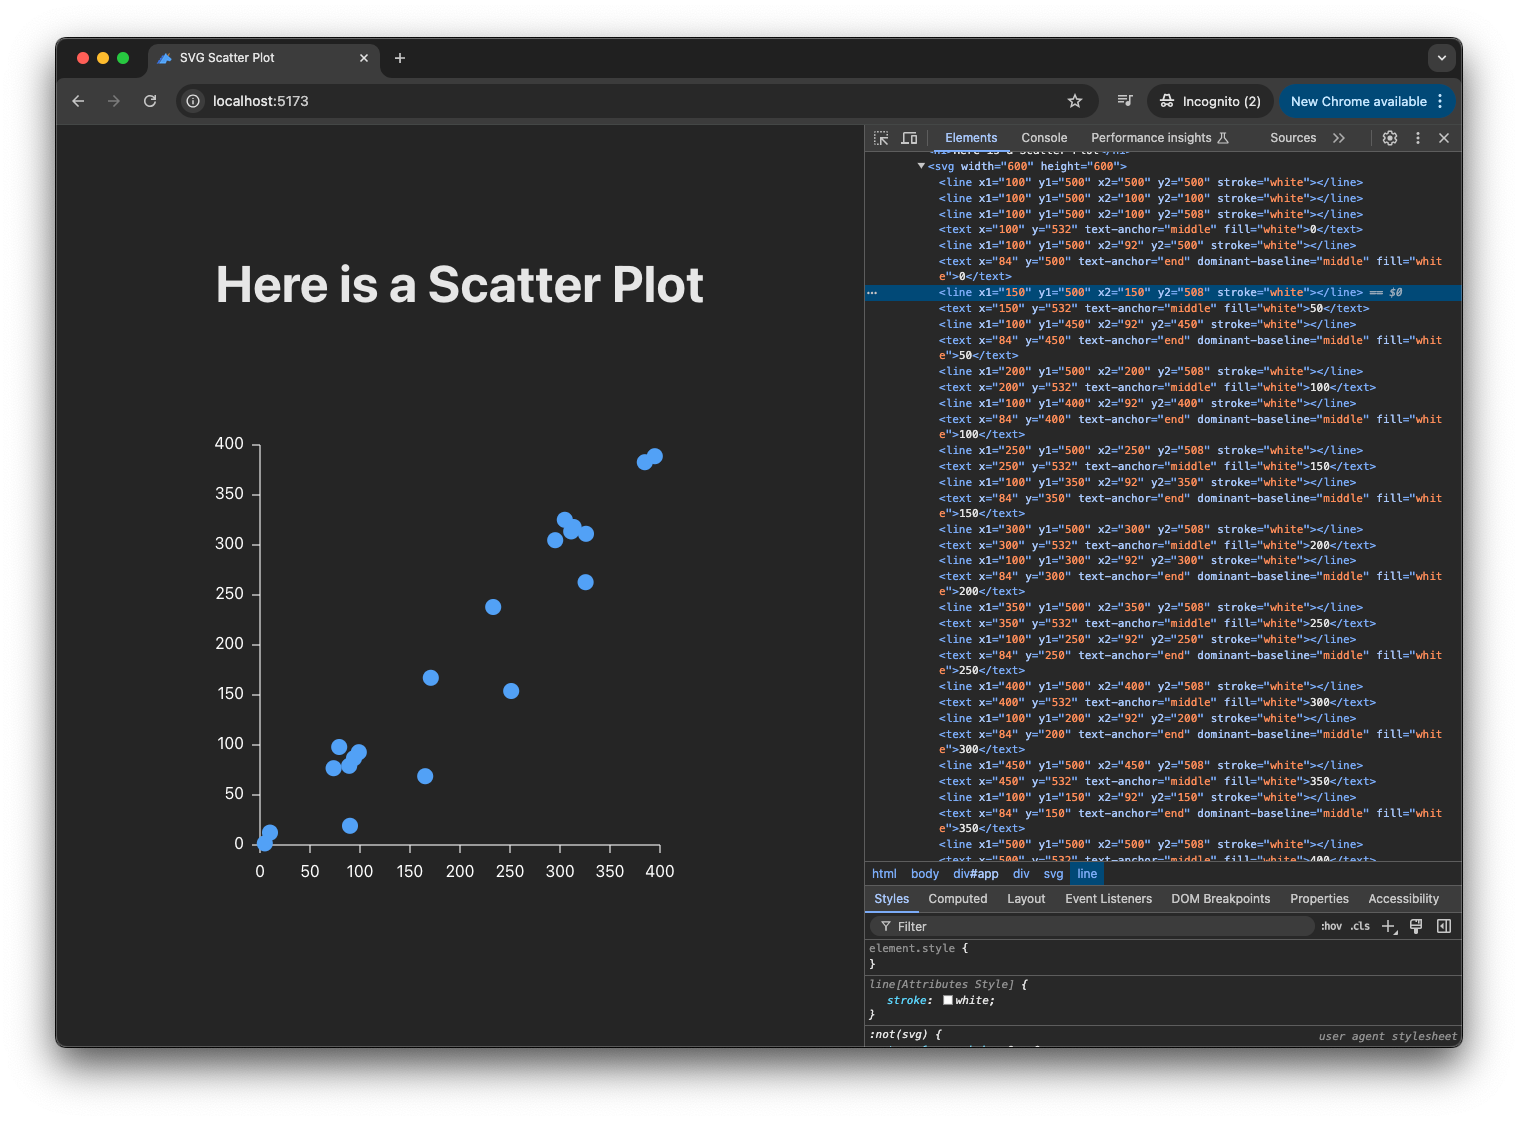
Lastly, to make a plot really look like a plot, we will add tick marks on the axes and label the values. This is a mixture of drawing more lines, and adding text. Creating text in SVG is exactly the same as creating circles and lines, except we just use text instead of circle and line.
// src/main.js

// Other code remains the same.

function createScatterPlot(data) {
  // Set the width and height of the SVG element.
  const width = 600;
  const height = 600;
  // You can choose some padding to position the plot.
  const padding = 100;

  // Create the SVG element using "createElementNS"
  // "createElementNS" is a special method used for creating XML/SVG elements
  // because SVG uses a different XML namespace than regular HTML.
  const svg = document.createElementNS("http://www.w3.org/2000/svg", "svg");
  svg.setAttribute("width", width);
  svg.setAttribute("height", height);

  // Create X axis (horizontal line)
  const xAxis = document.createElementNS("http://www.w3.org/2000/svg", "line");
  xAxis.setAttribute("x1", padding);
  xAxis.setAttribute("y1", height - padding);
  xAxis.setAttribute("x2", width - padding);
  xAxis.setAttribute("y2", height - padding);
  xAxis.setAttribute("stroke", "white");
  svg.appendChild(xAxis);

  // Create Y axis (vertical line)
  const yAxis = document.createElementNS("http://www.w3.org/2000/svg", "line");
  yAxis.setAttribute("x1", padding);
  yAxis.setAttribute("y1", height - padding);
  yAxis.setAttribute("x2", padding);
  yAxis.setAttribute("y2", padding);
  yAxis.setAttribute("stroke", "white");
  svg.appendChild(yAxis);

  // Add tick marks and labels
  for (let i = 0; i <= 400; i += 50) {
    // X axis ticks
    const xTick = document.createElementNS(
      "http://www.w3.org/2000/svg",
      "line",
    );
    const xPos = padding + i;
    xTick.setAttribute("x1", xPos);
    xTick.setAttribute("y1", height - padding);
    xTick.setAttribute("x2", xPos);
    xTick.setAttribute("y2", height - padding + 8);
    xTick.setAttribute("stroke", "white");
    svg.appendChild(xTick);

    // X axis labels
    const xLabel = document.createElementNS(
      "http://www.w3.org/2000/svg",
      "text",
    );
    xLabel.setAttribute("x", xPos);
    xLabel.setAttribute("y", height - padding + 32);
    xLabel.setAttribute("text-anchor", "middle");
    xLabel.setAttribute("fill", "white");
    xLabel.textContent = i;
    svg.appendChild(xLabel);

    // Y axis ticks
    const yTick = document.createElementNS(
      "http://www.w3.org/2000/svg",
      "line",
    );
    const yPos = height - padding - i;
    yTick.setAttribute("x1", padding);
    yTick.setAttribute("y1", yPos);
    yTick.setAttribute("x2", padding - 8);
    yTick.setAttribute("y2", yPos);
    yTick.setAttribute("stroke", "white");
    svg.appendChild(yTick);

    // Y axis labels
    const yLabel = document.createElementNS(
      "http://www.w3.org/2000/svg",
      "text",
    );
    yLabel.setAttribute("x", padding - 16);
    yLabel.setAttribute("y", yPos);
    yLabel.setAttribute("text-anchor", "end");
    yLabel.setAttribute("dominant-baseline", "middle");
    yLabel.setAttribute("fill", "white");
    yLabel.textContent = i;
    svg.appendChild(yLabel);
  }

  // Draw circles corresponding to each data point.
  data.forEach((dataPoint) => {
    const circle = document.createElementNS(
      "http://www.w3.org/2000/svg",
      "circle",
    );
    const svgPoint = getSvgPoint(dataPoint, height, padding);
    circle.setAttribute("cx", svgPoint.x);
    circle.setAttribute("cy", svgPoint.y);
    circle.setAttribute("r", "8");
    circle.setAttribute("fill", "#52A1F6");
    svg.appendChild(circle);
  });

  return svg;
}

// Other code remains the same.
And now we have a completed scatter plot!
5. D3.js
Certainly it's quite tedious to construct SVG primitives into a full plot. We have to draw the individual circles and lines and compute their positions carefully.
In practice, we will almost always use a plotting library. And D3.js is one of the most popular data visualization toolkit. It has the reputation of having a steep learning curve, which, from my own experience, I agree. Looking back though, there is a reason. D3 is typically used by Data Scientists who wish to build engaging data visualization. Data Scientists typically have familiarity with R, Python, or SQL, and less so with JavaScript. Coming to D3, right away you'd need to learn many new concepts in the web development world: DOM, SVG, JavaScript, data binding, and more.
But now that we have covered many of these topics, approaching D3.js suddenly becomes much less intimidating! We can even add D3 to our application simply by installing it:
// Run this under your app directory, i.e., inside "simple-js-app"
> npm install d3
Another way of adding D3 to your app is to load it directly into index.html:
<!-- Add this to load D3; but since we are using Vite, npm install is preferred. -->
<script src="https://d3js.org/d3.v7.min.js"></script>
Now, in main.js, we can create a function to generate the same scatter plot with D3:
// src/main.js
import * as d3 from "d3";

// Other code remains the same.

function createD3Plot(data) {
  const width = 600;
  const height = 600;
  const plotOffset = 100;
  const plotSize = 400;

  // Create SVG container
  const svg = d3.create("svg").attr("width", width).attr("height", height);

  // Create scales
  const xScale = d3
    .scaleLinear()
    .domain([0, 400]) // Our data range
    .range([plotOffset, plotOffset + plotSize]); // SVG coordinates

  const yScale = d3
    .scaleLinear()
    .domain([0, 400])
    .range([plotOffset + plotSize, plotOffset]); // Flipped for Y axis

  // Add axes
  svg
    .append("g")
    .attr("transform", `translate(0,${plotOffset + plotSize})`)
    .call(d3.axisBottom(xScale));

  svg
    .append("g")
    .attr("transform", `translate(${plotOffset},0)`)
    .call(d3.axisLeft(yScale));

  // Add points
  svg
    .selectAll("circle")
    .data(data)
    .join("circle")
    .attr("cx", (d) => xScale(d.x))
    .attr("cy", (d) => yScale(d.y))
    .attr("r", 8)
    .attr("fill", "#52A1F6");

  return svg.node();
}

function createAppElement() {
  const app = document.querySelector("#app");
  const container = document.createElement("div");

  // Add our manual SVG plot
  const heading1 = document.createElement("h2");
  heading1.textContent = "Manual SVG Plot";
  container.appendChild(heading1);
  container.appendChild(createScatterPlot(dataPoints));

  // Add D3 plot
  const heading2 = document.createElement("h2");
  heading2.textContent = "D3 Plot";
  container.appendChild(heading2);
  container.appendChild(createD3Plot(dataPoints));

  app.appendChild(container);
}

// Other code remains the same.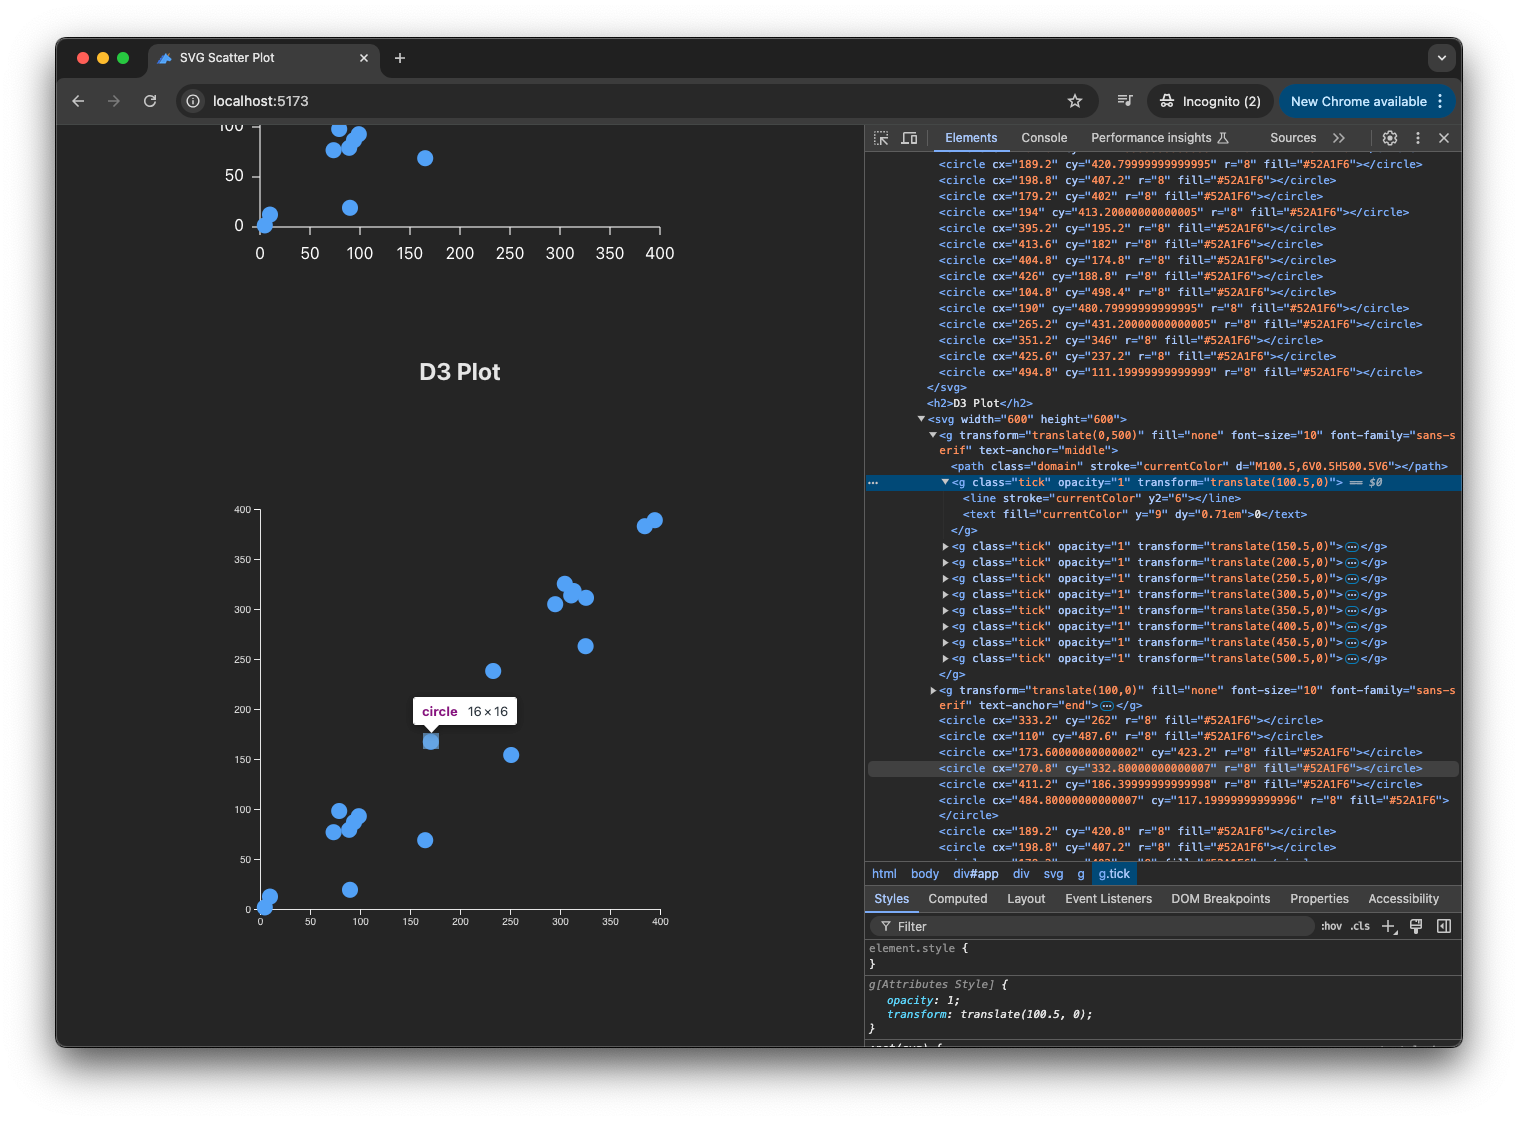
Now we have the same scatter plot, but created with D3!
What's Next
Today we had a whirlwind tour of JavaScript. We covered a lot of topics that are building blocks of web development. While I don't expect you to be starting from individual SVG primitives when you make plots in the future, many of the knowledge nuggets here will be useful whenever you approach web-based data visualization. Even if you end up with a JavaScript framework like React, leveraging existing plotting libraries (which is what I'd recommend as of 2024), foundational knowledge will come in handy when you want to customize your visualization to make it unique and engaging!


